Cold Email Open Rates in 2026: Benchmarks + Why They Lie
Cold email open rate benchmarks for 2026 — average, good, and B2B numbers — plus why Apple MPP and Gmail proxies inflate opens and what to track instead.
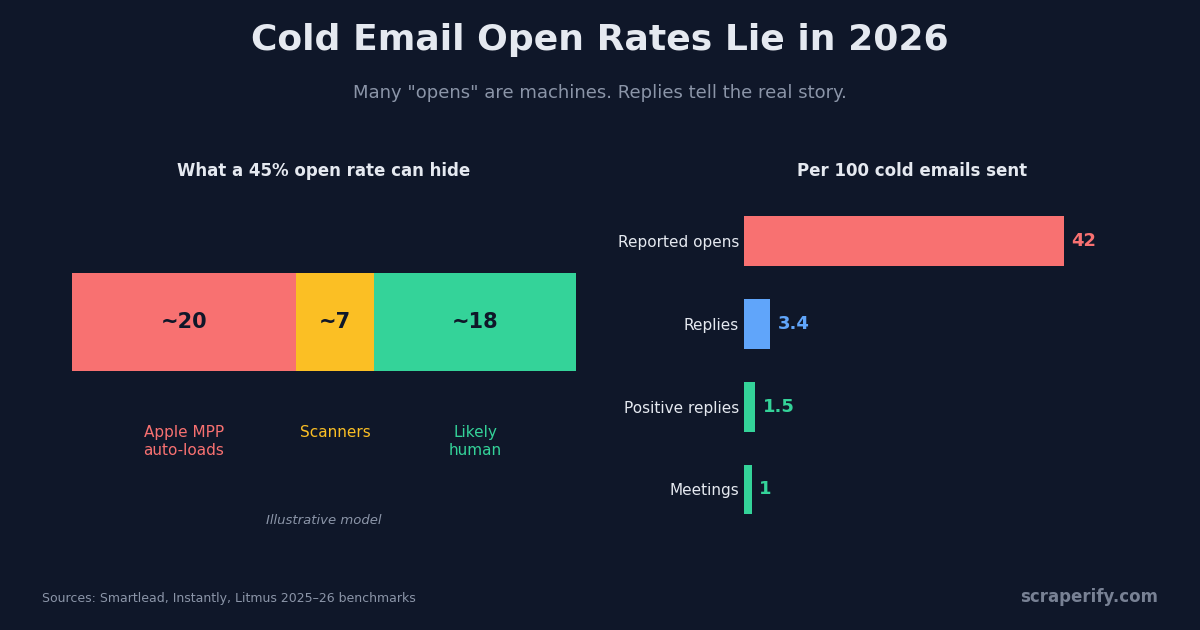
Every cold email tool shows you an open rate. It sits at the top of the dashboard, it moves when you change a subject line, and it is the number most people screenshot when a campaign “works.” But the cold email open rate you see in 2026 is one of the least reliable numbers in sales.
Here is the uncomfortable part: a large share of reported opens never involved a human. Apple’s Mail Privacy Protection pre-loads images in the background. Gmail fetches images through its own proxy. Corporate security scanners open messages to check links before anyone sees them. Each of these trips the tracking pixel and gets counted as an open.
This guide gives you the honest version. We cover the published cold email open rate benchmark numbers for 2026, explain exactly why they are inflated, show you how to test what an open really means with your own inbox, and lay out the metrics that actually predict meetings booked.
Cold Email Open Rate Benchmarks for 2026
Let’s start with the numbers everyone searches for. Published cold email open rates vary wildly depending on who measured them and how:
- ~42% average open rate — Smartlead platform data, as summarized by LevelUp Leads’ 2025 benchmark roundup.
- ~24% open rate — an older Gartner figure for cold sales email, frequently cited as the “conservative” number.
- 3.43% average reply rate — Instantly’s platform-wide cold email response rate for 2025–2026.
- 0.45% average reply rate — Belkins’ 2026 study of strictly net-new cold outreach across its 2025 campaigns, a figure the authors note carries “no open-rate inflation.”
Notice the spread. Open rates published by tool vendors cluster between 25% and 45%. Reply rates sit between roughly 0.5% and 5%. That means somewhere between nine and ninety “opens” happen for every reply. If those opens were real people reading your message, the reply math would look very different.
What Is the Average Cold Email Open Rate?
The honest answer: the average cold email open rate reported by sending platforms in 2025–2026 lands around 27% to 45%. Most aggregated benchmarks settle near the middle of that range. If your dashboard shows something in that band, your campaign is “normal” — but normal by a measurement system that counts machines as readers.
What Is a Good Cold Email Open Rate?
A good cold email open rate is usually defined as 40% or higher, with 50%+ treated as excellent. Below 20% is the conventional red flag for deliverability problems or weak subject lines. These thresholds are still useful as a relative signal — a sudden drop from 45% to 15% almost always means something broke — but they say little about how many people actually read your email.
B2B Cold Email Open Rates by Audience
B2B cold email open rates shift depending on who you target:
- Founders and owners respond most. Belkins found founders and owners replied at 0.57% versus 0.42% for C-level executives in its strict dataset.
- Smaller companies reply more than large enterprises, largely because fewer gatekeepers and filters sit between your email and the decision-maker.
- Enterprise domains often show higher open rates and lower reply rates — a classic sign of security scanners opening every message.
- Local businesses (contractors, clinics, agencies) tend to use consumer-grade inboxes, where Apple Mail and Gmail proxy behavior dominate the open signal.
That last pattern matters. A campaign to enterprise IT buyers can post a 60% open rate with almost zero replies, because a security gateway “opened” every single message.
COLD EMAIL OPEN RATE: WHAT 45 “OPENS” PER 100 EMAILS CAN HIDE
~20 opens
Apple MPP pre-loads images whether or not anyone reads
~7 opens
Security gateways and prefetch checking links
~18 opens
Plausibly a person — still not guaranteed
Illustrative model, not measured data. The mix varies by list: consumer inboxes skew toward Apple MPP, enterprise domains toward scanners. Readers with images blocked appear in none of these bars.
Why Your Cold Email Open Rate Is Inflated
To understand why the cold email open rate lies, you need to know how an “open” gets recorded in the first place. It is not magic, and it is not a read receipt.
Every open-tracking system works the same way: the sending tool inserts a tiny, invisible image into your email. That image lives on the tool’s server with a unique address. When something loads the image, the server logs a request — and the dashboard calls that request an open. (For a clear technical walkthrough of the full chain, MailPixel’s explainer on how email tracking works is one of the most honest write-ups available.)
The key word is something. The server cannot see a human. It only sees that a computer asked for the image. Four kinds of computers ask for it.
Apple Mail Privacy Protection
Apple introduced Mail Privacy Protection (MPP) in 2021. When enabled, Apple’s servers download all remote images in an email in the background — including tracking pixels — regardless of whether the recipient ever opens the message. It also hides the recipient’s IP address, so location data is meaningless too.
The scale is enormous. According to Litmus’ email client market share data, Apple accounted for 49.29% of email opens in January 2025, and later reports put MPP-affected opens at more than half of all tracked opens. If even a third of your list reads on an iPhone or Mac with MPP turned on, a big slice of your cold email open rate is Apple’s servers, not your prospects.
Gmail’s Image Proxy
Gmail does not let email clients fetch images directly. Instead, Google’s image proxy fetches and caches images on the reader’s behalf. This hides the recipient’s network and means repeat opens are often invisible because the image was already cached.
Worse for accuracy, the proxy can fetch the image at moments that have nothing to do with the recipient reading. MailPixel ran a controlled test in Gmail on September 20, 2026 and published the full timeline: the pixel received two requests from Gmail’s image proxy before the email was even sent — one when the URL was previewed and one when the image was inserted into the draft — and further requests when the recipient opened the message. All four requests carried the same User-Agent, so the server alone could not tell preparation from reading. You can see the full log in their tested Gmail tracking pixel guide.
Security Scanners and Link Checkers
Companies running Proofpoint, Mimecast, Microsoft Defender, or similar gateways scan inbound mail before delivery. Some scanners render the message and load images to inspect it. Many also “click” every link to check for malware. The result: an open (and sometimes a click) within seconds of delivery, every time, from a machine.
This is why b2b cold email open rates to larger companies can look spectacular while replies stay flat. The tell is timing — an open logged within a few seconds of delivery, often with a click at the same second, is almost never a person.
Image Blocking (the Opposite Problem)
Not every error inflates the number. Some readers block remote images by default — common in Outlook desktop configurations and privacy-focused clients. They can read every word of your email and never trigger the pixel. Your cold email open rate undercounts these people completely.
So the open signal is wrong in both directions at once: machines add opens that never happened, and blocked images hide reads that did. That is why a raw open rate cannot tell you how many people read your message — only that something requested an image.
How Email Open Tracking Actually Works
It helps to see the full path once. When you understand the mechanism, interpreting your cold email open rate becomes far less mysterious.
HOW AN “OPEN” GETS COUNTED IN EMAIL OPEN TRACKING
Your email
Contains a 1×1 image with a unique URL
Server log
One request = one “open” on your dashboard
Four very different sources produce the identical signal. Only one of them is your prospect.
The Pixel and the Request
Every email open tracking system generates an opaque identifier for each message (or each recipient). The pixel URL contains that identifier. When the image is requested, the server records the identifier, a timestamp, and request headers. That is the entire raw dataset behind every open rate on every dashboard.
Why Dashboards Look More Precise Than the Data
Many tools then decorate that request with a location, a device type, and an “opened 3 times” counter. But with Apple hiding IPs and Gmail proxying through Google’s network, the location often reflects a data center, the device is a guess, and the count is shaped by caching. The dashboard looks precise; the underlying evidence is not.
What the Signal Is Good For
None of this means open tracking is useless. A request is still a clue. It confirms your message probably reached an inbox rather than bouncing. A cluster of requests days after sending suggests someone came back to it. And a pixel that never fires across hundreds of sends is a strong sign of a deliverability problem. The trick is treating every open as context, not proof.
How to Test Your Real Cold Email Open Rate
The best way to stop trusting inflated numbers is to watch the raw signal yourself. You do not need a paid sales engagement platform for this. A single hosted tracking pixel and two inboxes you control are enough to see exactly what your tools are counting.
Step 1: Create a Standalone Tracking Pixel
Use a free email tracking pixel generator like MailPixel. It creates a hosted 1×1 image and a separate private activity link — no account, no mailbox connection, and the pixel expires after 30 days. Because the tool never loads the pixel on the creation screen, the activity log starts at zero, which makes it ideal for a clean experiment.
Give the pixel a neutral label (never an email address or message content) and copy the pixel URL. Keep the private activity page open in a separate tab.
Step 2: Send a Controlled Test
Insert the pixel into a draft. In Gmail, use Insert photo → Web Address (URL) and pasting the pixel URL. Send the email to a second account you control — ideally one opened in a different browser, and ideally one on an iPhone with Mail Privacy Protection enabled.
Do not open the public pixel URL yourself in a browser. That creates an extra request and spoils the test.
Step 3: Read the Timeline, Not the Count
Now watch the activity page while you go through each step: preview, insert, send, wait, open, re-open. Note which actions create a request. In most tests you will see requests that happen before any human reads the message, and opens that produce no new request at all because of caching.
Run the same test with an Apple Mail recipient and you will typically see a request arrive shortly after delivery even if you never touch the message. That single experiment will recalibrate how you read every cold email open rate dashboard from now on.
See What an “Open” Really Is
Create a free hosted tracking pixel in one click, send it to your own inbox, and watch the raw request timeline. No account or mailbox connection required.
Create a Free Pixel on MailPixel →30-day pixels · Private activity link · Gmail Chrome extension available
Metrics That Matter More Than Cold Email Open Rate
If the cold email open rate cannot tell you who read your message, what should you optimize instead? Move down the funnel to metrics that require a human to act.
COLD EMAIL METRICS RANKED BY RELIABILITY
| Metric | 2026 Benchmark | Machines Can Fake It? | Reliability |
|---|---|---|---|
| Open rate | 27–45% | Yes — MPP, proxies, scanners | ●●●● |
| Click rate | 1–4% | Often — link scanners | ●●●● |
| Reply rate | 0.5–5% | Rarely — auto-replies only | ●●●● |
| Positive reply / meetings | ~1–2% | No | ●●●● |
Benchmark ranges compiled from Smartlead, Instantly, and Belkins 2025–2026 data. Ranges vary widely by list quality and targeting.
Reply Rate
Reply rate is the closest thing to ground truth in cold outreach. A machine will not write back (auto-replies aside, which you should filter out). Industry roundups put the average B2B cold email reply rate around 3–5%, with 5%+ considered solid and 10%+ excellent. If your cold email open rate goes up but replies do not, the “improvement” was probably a change in who your pixel is reaching, not who is reading.
Positive Reply Rate
Not every reply is good news. “Remove me” counts as a reply. Track positive replies — interested responses, referrals to the right person, requests for more information — as a separate number. Across platform benchmarks this typically lands around 1–2% of sends.
Meetings Booked per 100 Leads
This is the metric your revenue actually depends on. Divide meetings booked by leads contacted. It folds list quality, copy, follow-up, and offer into a single number, and no privacy proxy on earth can inflate it.
Bounce Rate
Bounce rate is the one technical metric worth watching closely. Hard bounces are recorded by mail servers, not pixels, so they are accurate. Keep bounces under roughly 2–3%; above that, mailbox providers start treating your domain as a spammer, and every other metric suffers.
Low Cold Email Open Rates Usually Mean a List Problem
Here is something most benchmark articles skip. When your cold email open rate is genuinely low — not slightly below benchmark, but under 15–20% — the cause is rarely your subject line. It is almost always the list.
Bad Data Kills Deliverability
Lists bought from data vendors or scraped years ago are full of dead addresses, role accounts, and spam traps. Send to them and your bounce rate spikes, mailbox providers lower your sender reputation, and future emails quietly land in spam. A spam-foldered email produces no opens at all, real or fake.
B2B contact data decays at roughly 22–30% per year. A list that was clean twelve months ago is now a deliverability risk.
Fresh, Targeted Lists Beat Volume
The fix is building lists from current, public sources and filtering tightly before you send. For local businesses, the Yelp Scraper Chrome Extension exports companies with phone numbers, websites, ratings, and categories — today’s data, not last year’s. For B2B professionals, you can export LinkedIn contacts to Excel and segment by title and company before enrichment.
Review platforms make great signals too. A business with a string of recent negative reviews has a visible, urgent problem — export Google reviews to CSV and you can reference that pain directly in your first line. Relevance is what moves real replies, which is the only open-adjacent metric that matters.
Two-Stage List Building
The most reliable workflow has two stages: source a company list from a public platform, then enrich it with verified contacts. We break down the tools for each stage in our guide to the best lead generation Chrome extensions. Verify every address before it touches your sending tool — verification costs fractions of a cent and protects the domain that every future campaign depends on.
Better Lists, Better Reply Rates
Scraperify’s Chrome extensions export fresh business leads from Yelp, LinkedIn, Glassdoor, Trustpilot, and 36 more platforms — straight to CSV or Excel.
Browse All Scrapers →Free tier on every extension · $19.99/month · $79 lifetime
How to Improve Your Cold Email Open Rate (the Real Way)
You still want more people to actually open your emails. These are the levers that improve human opens — the part of your cold email open rate worth caring about.
Fix Authentication First
Set up SPF, DKIM, and DMARC on every sending domain. Since Google and Yahoo’s 2024 bulk sender requirements, unauthenticated mail is increasingly filtered or rejected outright. Use a separate domain for cold outreach so a reputation problem never touches your main business email.
Warm Up and Throttle
New domains and mailboxes need a warm-up period of a few weeks with gradually increasing volume. After that, keep daily sends per mailbox modest — many teams cap at 30–50 cold emails per inbox per day — and spread volume across multiple inboxes rather than blasting from one.
Write Subject Lines for Humans
Short, plain, lowercase subject lines that look like a colleague wrote them consistently outperform clever marketing headlines. Avoid spam trigger words, excessive punctuation, and fake “Re:” prefixes. Mention something specific to the recipient — their company, city, or a recent review — where you can.
Send Less Tracking Weight
Here is a counterintuitive one: some deliverability practitioners turn open tracking off for cold campaigns. Tracking pixels and rewritten links add markup that filters can associate with bulk mail. If you are going to rely on replies as your primary metric anyway, removing tracking from the main campaign — and testing open behavior separately with a standalone pixel — can be a reasonable trade.
Cold Email Follow-Up: Where Real Replies Come From
Most replies do not come from the first email. Industry studies, including Backlinko’s widely cited outreach analysis, consistently find the first follow-up adds a large share of total replies. A disciplined follow-up sequence will move results far more than squeezing a few points out of your cold email open rate.
A SIMPLE 4-TOUCH COLD EMAIL FOLLOW-UP SEQUENCE
Day 1
Initial email
Specific problem, one clear ask
Day 3–4
Follow-up #1
Short bump in the same thread
Day 7–8
Follow-up #2
New angle: proof, case, or data point
Day 14
Break-up
Polite close, easy yes/no
Stop the sequence the moment anyone replies. Never use an “open” alone to trigger an aggressive follow-up.
Don’t Trigger Follow-Ups on Opens Alone
Many tools let you send a follow-up when a prospect “opens three times.” Given everything above, that trigger fires on Apple’s servers and security scanners as often as on people. Prospects who never read your email get a creepy “saw you checked out my email” message. Time-based follow-ups are safer and more honest.
Use Opens as Context, Not Evidence
If you do look at open activity, use it as soft context. A request days after sending, from a recipient who otherwise never triggered the pixel, might mean a forward or a second look. It is a reason to keep someone in the sequence — never a reason to claim they read something.
Common Cold Email Open Rate Mistakes
Celebrating a high open rate with no replies. A 60% cold email open rate with a 0.2% reply rate is not a success. It is usually a sign of scanner-heavy enterprise domains or Apple MPP inflation.
A/B testing subject lines on opens. If half your opens are automated, subject line tests measured by opens produce noise. Judge subject line tests by reply rate, and run them at enough volume for the difference to matter.
Comparing your numbers to vendor benchmarks. Different tools filter bot opens differently — some aggressively, some not at all. Your open rate on one platform is not comparable to a benchmark published by another.
Assuming no open means no read. Image blocking and caching hide real reads. Someone can read your email, never trigger the pixel, and reply two weeks later.
Ignoring list quality. No subject line can rescue a stale or unverified list. Fresh, targeted data does more for your cold email open rates than any copy tweak.
FAQs
What is a good cold email open rate in 2026?
A good cold email open rate is generally 40% or higher by most tool dashboards, with 20% as the warning threshold. But because Apple MPP and image proxies inflate opens, treat that number as a relative health check and judge campaigns primarily by reply rate.
What is the average cold email open rate?
Published platform data puts the average cold email open rate at roughly 27–45% for 2025–2026. Smartlead data summarized in 2025 benchmarks showed about 42%, while older Gartner research cited around 24%.
Why is my cold email open rate so high but nobody replies?
Automated opens. Apple Mail Privacy Protection pre-loads images, Gmail’s proxy fetches them, and corporate security scanners open messages on delivery. All of these register as opens without a human reading anything. Look at reply rate and positive reply rate instead.
Are cold email open rates accurate?
Not as a count of human readers. Email open tracking records image requests, and many requests come from machines. Meanwhile, readers who block images never register. Open rates remain useful for spotting sudden deliverability drops, but they are not a reliable measure of attention.
How can I tell if someone actually opened my email?
You cannot know with certainty from a pixel alone. A reply is the only reliable confirmation. To understand what your tracker is really measuring, run a controlled test: create a standalone pixel with a tool like MailPixel, send it to an inbox you control, and compare the request timeline with what you actually did.
Should I turn off open tracking for cold emails?
Many teams do. Removing tracking pixels can slightly improve deliverability and forces you to optimize for replies. If you want open data, test it separately on a small sample instead of instrumenting every cold email.
The Bottom Line on Cold Email Open Rates
The cold email open rate on your dashboard is a measure of image requests, and in 2026 a large share of those requests come from Apple’s privacy servers, Gmail’s proxy, and corporate security scanners. Benchmarks of 27–45% are real numbers — they just do not describe how many people read your email.
Use open rate as a smoke alarm for deliverability, not a scoreboard. Run your own pixel test once so you know what an “open” really looks like — MailPixel makes that a two-minute experiment. Then put your effort where results actually come from: fresh, well-targeted lead lists, authenticated sending domains, and a patient follow-up sequence judged by replies and meetings booked.