Free Depop Spreadsheet Template for Resellers (2026)
Free Depop spreadsheet template with inventory tracker, sales log, profit calculator, and pricing research tabs. Built for resellers and side hustlers.
Running a Depop reselling business without a spreadsheet is like driving without a dashboard — you have no idea if you are making money, losing money, or just spinning your wheels. Most Depop sellers track nothing. They buy items, list them, sell some, and check their bank balance at the end of the month. The ones who actually build profitable businesses track everything: sourcing costs, listing prices, actual sold prices, fees, shipping costs, and profit per item.
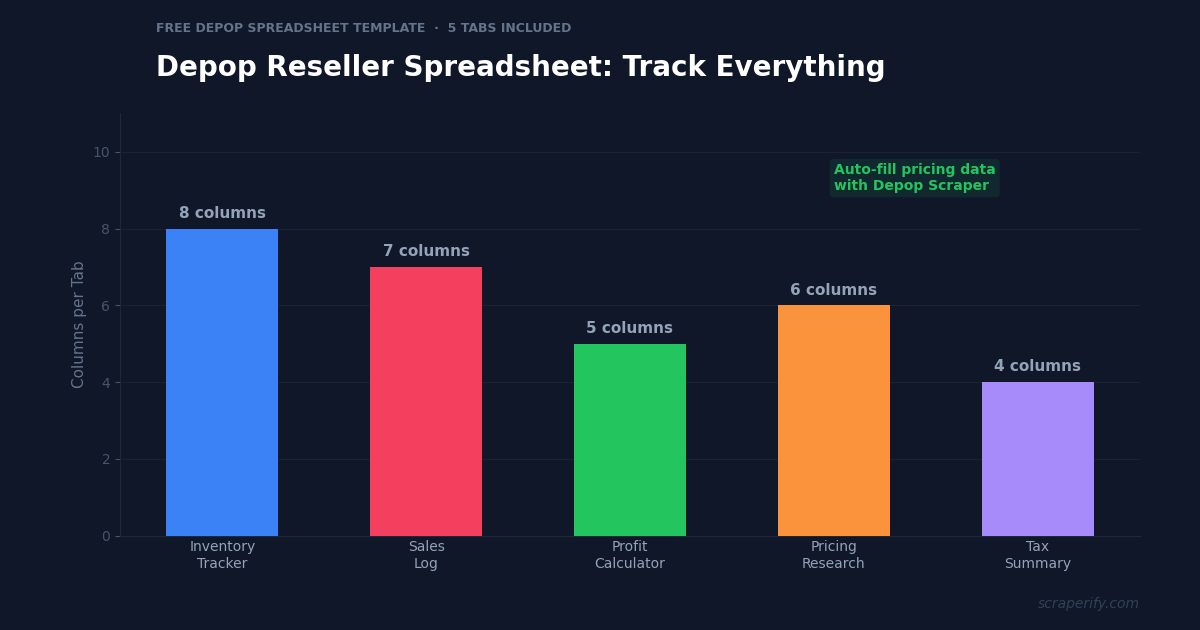
This guide gives you a free Depop spreadsheet template with 5 tabs designed specifically for resellers. We also show you how to auto-fill pricing research data using the Depop Scraper Chrome Extension — so you spend less time on data entry and more time sourcing and selling.
Why Every Depop Seller Needs a Spreadsheet
Before we get to the template, here is why tracking matters:
You do not know your actual profit margin. You bought a jacket for $8, sold it for $45. Profit is $37, right? Wrong. Subtract the $4 you spent on shipping supplies, the $3 in gas driving to the thrift store, and the 3 hours you spent photographing, listing, and shipping — suddenly your “profit” is $30 for 3 hours of work, or $10/hour. Without tracking, you never see these numbers.
Depop’s 1099-K hits at $600. In the US, Depop must report your sales to the IRS if you earn $600 or more in a calendar year. Without organized sales records, tax time becomes a nightmare of scrolling through months of Depop transactions trying to reconstruct your income and deductible expenses.
Pricing by gut feeling leaves money on the table. Sellers who check comparable prices before listing earn 15-25% more on average than those who guess. A spreadsheet with competitor pricing data — filled using the Depop Scraper Chrome Extension — gives you data-driven pricing for every item.
Inventory tracking prevents lost items. When you have 50+ unsold items across closets, bins, and storage spaces, it is easy to lose track. A spreadsheet tells you exactly what you have, where it is, and how long it has been listed.
The Free Depop Spreadsheet Template (5 Tabs)
Here is what each tab does and which columns to include:
Tab 1: Inventory Tracker
This tab tracks every item from the moment you source it until it sells or gets donated.
| Column | What to Enter | Why It Matters |
|---|---|---|
| Item # | Sequential number (001, 002…) | Unique identifier for each item |
| Item Description | ”Vintage Nike windbreaker, blue, L” | Quick reference |
| Brand | Nike, Levi’s, Carhartt, etc. | Track which brands sell best |
| Size | S, M, L, XL, or specific measurements | For filtering |
| Source | Thrift store, garage sale, clearance | Track best sourcing channels |
| Source Date | Date purchased | Track how long items sit |
| Source Cost | What you paid | COGS for profit calculation |
| Listing Price | Your asking price on Depop | Current listing price |
| Status | Listed / Sold / Donated / Returned | Current state |
| Storage Location | Bin A, Closet 2, etc. | Find items when they sell |
Tab 2: Sales Log
This tab records every sale with all the financial details needed for profit calculation and taxes.
| Column | What to Enter | Why It Matters |
|---|---|---|
| Item # | Links to Inventory Tracker | Cross-reference |
| Sold Date | Date the sale completed | Tax reporting |
| Sold Price | Actual transaction price | Revenue |
| Shipping Charged | What the buyer paid for shipping | Revenue or cost offset |
| Shipping Cost | What you actually paid to ship | Expense |
| Depop Fee | $0 (Depop has zero seller fees) | Verification |
| Payment Processing Fee | PayPal or Stripe fee (~2.9% + $0.30) | Expense |
| Packaging Cost | Mailer, tissue paper, stickers | Expense |
| Profit | Sold Price - Source Cost - Shipping - Fees - Packaging | The number that matters |
Tab 3: Profit Calculator
This tab summarizes your business performance by time period.
| Row | Formula | Purpose |
|---|---|---|
| Total Revenue (Month) | SUM of Sold Prices | Gross income |
| Total COGS | SUM of Source Costs for sold items | Cost of goods |
| Total Shipping Costs | SUM of actual shipping paid | Expense |
| Total Fees | SUM of payment processing fees | Expense |
| Total Packaging | SUM of packaging costs | Expense |
| Net Profit | Revenue - COGS - Shipping - Fees - Packaging | Your actual earnings |
| Items Sold | COUNT of sales | Volume |
| Average Profit Per Item | Net Profit / Items Sold | Efficiency metric |
| Average Days to Sell | AVG(Sold Date - Source Date) | Inventory turn speed |
| ROI | Net Profit / Total COGS × 100% | Return on investment |
Tab 4: Pricing Research
This tab stores competitor pricing data to inform your own listing prices. This is where the Depop Scraper Chrome Extension saves you hours.
| Column | What to Enter | Source |
|---|---|---|
| Product Category | ”Vintage Nike windbreaker” | Your item |
| Depop Avg Price | Median price from Depop exports | Depop Scraper CSV |
| Depop Price Range | Min-Max from exported data | Depop Scraper CSV |
| eBay Sold Price | Median sold price | eBay Scraper CSV |
| Vinted Avg Price | Average from Vinted exports | Vinted Scraper CSV |
| Mercari Avg Price | Average from Mercari exports | Mercari Scraper CSV |
| Recommended Price | Your data-informed listing price | Based on cross-platform data |
| Last Updated | Date of most recent export | Keep data fresh |
Instead of manually browsing 50 Depop listings to check prices, export with the Depop Scraper Chrome Extension, calculate the median in the spreadsheet, and paste it into this tab. Do the same with eBay, Vinted, and Mercari for cross-platform comparison. This process takes 10 minutes with scrapers versus 2+ hours manually.
Tab 5: Tax Summary
This tab organizes your data for tax filing — essential when your Depop sales exceed $600 and you receive a 1099-K.
| Row | Formula | Purpose |
|---|---|---|
| Gross Sales (Year) | SUM of all Sold Prices | What Depop reports to the IRS |
| Cost of Goods Sold | SUM of all Source Costs | Deductible expense |
| Shipping Expenses | SUM of all shipping costs you paid | Deductible expense |
| Packaging Expenses | SUM of packaging costs | Deductible expense |
| Mileage (if driving to source) | Miles × IRS rate ($0.67/mile in 2026) | Deductible expense |
| Home Office (if applicable) | Portion of rent/mortgage for workspace | Deductible expense |
| Net Taxable Income | Gross Sales - All Deductions | What you actually owe taxes on |
Without this tab, you pay taxes on your gross sales ($5,000) instead of your net profit ($2,500). That mistake can cost you $500-$1,500 in unnecessary taxes.
Auto-fill your pricing research tab
The Depop Scraper Chrome Extension exports competitor listings to CSV — paste median prices directly into your spreadsheet.
Add Depop Scraper to Chrome — FreeHow to Use the Depop Spreadsheet Template
Getting Started (5 Minutes)
- Create a new Google Sheet (or download an Excel file).
- Create 5 tabs named: Inventory, Sales, Profit, Pricing Research, Taxes.
- Add the column headers from the tables above.
- Enter your existing inventory — everything you currently have listed or in stock.
- Set up formulas in the Profit and Tax tabs (SUM, AVERAGE, COUNT).
Daily Workflow (2 Minutes)
When you source an item: add a new row to the Inventory tab with item details, source cost, and source date.
When you list an item: update the Status column to “Listed” and enter your listing price.
When an item sells: add a row to the Sales tab with sold price, shipping cost, and fees. Update the Inventory tab status to “Sold.”
Weekly Workflow (10 Minutes)
Every week, review your Profit tab:
- How many items sold this week?
- What was the average profit per item?
- Which brands had the highest margins?
- How many unsold items are older than 30 days? (Consider price drops)
Monthly Workflow (15 Minutes with Scrapers)
Update your Pricing Research tab monthly:
- Export competitor listings from Depop using the Depop Scraper Chrome Extension.
- Export eBay sold prices using the eBay Scraper Chrome Extension.
- Calculate median prices for your top 10 product categories.
- Paste the updated medians into the Pricing Research tab.
- Adjust listing prices for items that are overpriced based on current market data.
This monthly pricing update is what separates casual sellers from profitable businesses. Items priced based on current market data sell faster and at higher margins than items priced by guesswork.
Key Metrics Every Depop Seller Should Track
Your spreadsheet should help you calculate these metrics monthly:
Profit Margin per Item
Formula: (Sold Price - Source Cost - All Fees) / Sold Price × 100
A healthy Depop reselling margin is 50-70%. If your margin drops below 40%, you are either paying too much for inventory or pricing too low. The spreadsheet reveals which items have the best margins — source more of those.
Inventory Turnover
Formula: Items Sold / Average Inventory on Hand
If you have 100 items listed and sell 20 per month, your turnover is 0.2 — meaning each item sits for an average of 5 months. A turnover of 0.5 or higher (selling half your inventory monthly) is the goal. Low turnover means your items are overpriced or in low-demand categories.
Average Days to Sell
Formula: Average of (Sold Date - Source Date) for all sold items
If your average days to sell is 45, items sit for 6+ weeks before selling. Under 14 days is excellent. Over 60 days means pricing or category issues. Track this metric monthly to see if your sourcing and pricing decisions are improving.
Cost of Unsold Inventory
Formula: SUM of Source Costs for all items with Status = “Listed” and Listed Date > 60 days ago
This number represents money you have spent on items that are not selling. If you have $500 in inventory older than 60 days, that is $500 tied up in dead stock that should be discounted, relisted, crosslisted to other platforms, or donated.
Best Sourcing Channel
Group your sales by Source (thrift store, garage sale, online clearance, etc.) and calculate average profit per item for each channel. This tells you where to spend your sourcing time. If thrift stores yield $15 average profit per item but garage sales yield $25, prioritize garage sales.
Supercharging Your Spreadsheet with Scraperify
The biggest time sink in maintaining a reselling spreadsheet is pricing research. Checking what comparable items sell for on Depop, eBay, Vinted, and Mercari manually takes hours. Scraperify Chrome extensions reduce this to minutes:
Export Depop Competitor Data
Use the Depop Scraper Chrome Extension to export 50 comparable listings for each product category you sell in. The exported CSV contains prices, likes, conditions, and seller data. Calculate the median price in the spreadsheet and use it as your pricing anchor.
Validate with eBay Sold Prices
eBay sold prices are the most reliable market values. Export sold listings for your items using the eBay Scraper Chrome Extension. If the eBay sold median is $65 and the Depop listing median is $55, you know the maximum market price ($65) and the competitive Depop price ($55). Price somewhere in between based on your item’s condition.
Compare Across All Resale Platforms
For the most accurate pricing, export from all four resale platforms using their respective Scraperify extensions:
- Depop Scraper — Gen-Z fashion prices
- eBay Scraper — actual sold prices (gold standard)
- Vinted Scraper — European resale prices
- Mercari Scraper — US general marketplace prices
All four extensions export in the same CSV format, making cross-platform comparison effortless. Paste all exports into one spreadsheet and calculate the cross-platform average — the most accurate market value available.
Common Mistakes Depop Sellers Make Without a Spreadsheet
Forgetting to Track Sourcing Costs
Many sellers remember the big purchases ($20+ items) but forget the small ones ($2-$5 thrift store finds). Over a year, those forgotten small purchases add up to hundreds of dollars in untracked expenses — which means your actual profit is lower than you think. A spreadsheet ensures every dollar spent is recorded.
Not Accounting for All Fees
Depop has zero seller fees, but payment processing is not free. PayPal charges ~2.9% + $0.30 per transaction. Stripe is similar. On a $50 sale, that is $1.75 in fees. On 200 sales per year, that is $350 in fees you might not be accounting for. The spreadsheet’s Sales Log captures these fees per transaction.
Ignoring Time as a Cost
Professional resellers track hours spent sourcing, photographing, listing, packaging, and shipping. At $10/hour minimum (a conservative opportunity cost), 15 hours per week of reselling “costs” $600/month in time. If your net profit is $700/month, your effective hourly wage is only $11.67/hour. The spreadsheet does not track time by default, but adding a “Hours Spent” column transforms your understanding of profitability.
Never Adjusting Prices for Stale Inventory
Items that have been listed for 60+ days without selling are overpriced for the current market. Without a spreadsheet that tracks listing dates, you never notice these stale items. The Inventory Tracker’s “Source Date” column combined with the current date reveals exactly which items need price drops.
Paying Too Much Tax
Without organized expense records, many sellers pay taxes on their gross Depop revenue instead of their net profit. If you grossed $6,000 on Depop but spent $2,500 on inventory, $400 on shipping, and $300 on supplies, your taxable income should be $2,800 — not $6,000. The Tax Summary tab ensures you claim every legitimate deduction.
Frequently Asked Questions
Do I really need a spreadsheet for Depop selling?
If you sell more than 10 items per month or earn more than $600/year on Depop, yes. Without a spreadsheet, you do not know your actual profit, you risk overpaying on taxes, and you cannot identify which items and sourcing channels are most profitable.
Can I use Google Sheets or does it have to be Excel?
Both work. Google Sheets has the advantage of being free, accessible from any device, and easy to share if you have a business partner. Excel is better for complex formulas and large datasets. The template structure is the same for both.
How long does it take to maintain the spreadsheet?
About 2 minutes per day (adding new items and recording sales) plus 10-15 minutes per week for review. Monthly pricing research with Scraperify extensions adds another 15 minutes but saves hours compared to manual price checking.
What if I sell on multiple platforms, not just Depop?
The template works for multi-platform selling. Add a “Platform” column to the Sales Log (Depop, eBay, Vinted, Mercari, Poshmark) and filter by platform in your profit analysis. The Pricing Research tab already supports cross-platform comparison.
How does the Depop Scraper help with the spreadsheet?
The Depop Scraper Chrome Extension exports competitor listings to CSV. You can then calculate median prices from the exported data and paste them into the Pricing Research tab. This replaces hours of manual browsing with a 10-minute data exercise.
Start Using the Depop Spreadsheet Template Today
Copy the column structures from this guide into a new Google Sheet, enter your current inventory, and start tracking every purchase and sale. Within one month, you will have a clear picture of your actual profit margins, best-performing categories, and sourcing ROI.
For the pricing research tab, install the Depop Scraper Chrome Extension to export competitor data to CSV — eliminating the most time-consuming part of reselling spreadsheet maintenance.
Fill Your Pricing Tab in Minutes
The Depop Scraper Chrome Extension exports competitor listings, prices, and likes to CSV — paste directly into your pricing research spreadsheet.
Add Depop Scraper to Chrome — FreeFree tier · $19.99/month · $79 lifetime