Free Dropshipping Product Research (2026 Method)
How to do free dropshipping product research without paid tools. Triangulate supplier cost, retail price, and demand into one spreadsheet — full 2026 workflow.
Every guide to dropshipping product research tells you the same thing: check TikTok Creative Center, browse the AliExpress Dropshipping Center, scroll Amazon Best Sellers, watch Google Trends. All of that advice is correct. None of it is the reason people fail.
People fail because the free sources used for product research give you a browsing experience, not a dataset. You can scroll TikTok Creative Center for three hours of product research and end the session with a vague feeling that phone accessories are hot. You cannot sort that feeling by margin. You cannot filter it by review count. You cannot subtract supplier cost from retail price across 200 candidates in ten seconds, because the numbers were never in a spreadsheet to begin with.
This guide reframes free dropshipping product research as what it actually is — a spreadsheet problem, not a discovery problem. The winning products are already visible on free sites. What your product research is missing is the export.
Why Paid Product Research Tools Cost $39–$99/Month
Before building the free workflow, it is worth understanding exactly what the paid tools sell, because it explains why free product research is so achievable and why paid product research tools price the way they do.
Sell The Trend, Dropship.io, PPSPY, Minea, AutoDS, Pipiads — the pricing ranges from about $29/month at the entry tier to $99+/month for ad-spy features. Every one of these product research tools frames itself as “AI finds winning products for you.” Open one up and look at what you are actually staring at: a sortable table. Product name, image, supplier cost, retail price, estimated units sold, store count, first-seen date. You sort by a column. You filter by a range. You export to CSV.
That table is the product. The AI framing is packaging around a data-structuring service — product research sold as software.
And here is the part that matters for your product research budget: almost every number in that table was scraped from a public page you can visit yourself for free. Supplier cost comes from AliExpress. Retail price comes from Amazon, Walmart, or a Shopify storefront. Sold quantity comes from eBay’s sold listings or a marketplace’s own “1,000+ bought” badge. Demand signal comes from TikTok and Google Trends. Every input to their product research is an input you can reach yourself.
| What the paid tool shows | Where the data actually comes from | Free to access? |
|---|---|---|
| Supplier cost | AliExpress / Temu product pages | Yes |
| Retail price ceiling | Amazon, Walmart listings | Yes |
| Proof of actual sales | eBay sold listings (90 days) | Yes |
| Demand trend | Google Trends, TikTok Creative Center | Yes |
| Review volume / rating | Marketplace product pages | Yes |
| All of it in one sortable CSV | The actual paid feature | This is what you pay for |
Notice where the “no” lands. It is not on any data source. It lands on the row that says “all of it in one sortable CSV.” That single row is the $39/month. Solve that row yourself and free product research stops being a downgrade. Paid product research buys you a CSV, nothing more.
The Three Numbers Product Research Actually Needs
Strip away the product research dashboards and every product decision reduces to three numbers. If you can fill these three columns for 200 candidate products, you have done real product research. If you cannot, no product research subscription will save you.
1. Supplier cost. What you pay per unit, landed. AliExpress and Temu both publish this openly. Watch shipping — a $4.10 unit with $6 shipping is a $10.10 unit.
2. Retail ceiling. What the market already pays. This is the number most beginners guess at, and guessing instead of doing product research is why so many stores launch at prices nobody will pay. Amazon and Walmart give you the asking price. eBay sold listings give you something better — the transacted price, what buyers actually paid in the last 90 days. Asking price is an opinion. Sold price is a fact.
3. Demand direction. Is interest rising, flat, or dying? Google Trends and TikTok answer this in about 30 seconds per product.
Margin is number two minus number one. Timing is number three. That is the entire discipline of product research — everything else is presentation.
The widely cited rule of thumb is that a product should retail between $30 and $150. Below $30 you are chasing too many orders to cover ad costs. Above $150 impulse buying collapses and you need a much longer sales cycle. Combined with a 3x markup target, that puts your supplier cost sweet spot roughly between $8 and $45.
| Signal | Healthy range | Red flag |
|---|---|---|
| Retail price | $30 – $150 | Under $20 (ad math fails) |
| Gross margin | 3x cost or better | Under 2x |
| eBay sold count (90d) | 50+ units | Under 10 (no proven demand) |
| Amazon sellers on listing | Few, or none | Amazon itself is selling it |
| Google Trends slope | Rising or seasonal pre-peak | 12 months of decline |
| Unit weight | Under 1 kg | Bulky / fragile |
Seasonal vs Evergreen: Timing Changes the Product Research Math
One distinction worth internalizing before your product research starts collecting data, because it determines how you read the demand column.
Seasonal products spike for a few weeks and go quiet the rest of the year. Halloween decor, Christmas projectors, patio gear. The advantage is that competition is thin during the ramp, so entry is cheap and product research is faster. The catch is that timing is everything — you generally want to be live roughly six to eight weeks before the peak. For Halloween, that means launching in August, not October. And knowing when to stop matters just as much; inventory and ad spend committed after the peak is money burned.
Evergreen products sell at a steady rate all year. Baby gear, kitchen tools, pet supplies. The flat Google Trends line is the tell. Steady demand is genuinely attractive, but it also means there is no soft entry window — established sellers have been optimizing that listing for years. Competing there costs more in time, product research effort, and ad budget.
For a first store, seasonal pre-peak is usually the easier entry. Your product research should therefore capture the trend slope, not just the current level. Product research that records only today’s snapshot cannot tell rising from falling.
Turn browsing into a spreadsheet
Scraperify exports product listings, prices, and sold counts from AliExpress, Temu, Amazon, Walmart, eBay and TikTok Shop straight to CSV — the missing step in free product research.
See all scrapers — free tier availableStep 1: Build a Product Research Candidate List for Free
Good product research starts wide and cheap. The goal of this product research stage is 100–300 product names, not a decision.
TikTok Creative Center is the strongest free product research demand signal available right now. Top Ads shows you what advertisers are actively spending on, filterable by region and time window. If someone has been running the same creative for six weeks, they are profitable — nobody funds a losing ad for six weeks. Note the product and how long the ad has been live.
Google Trends takes 30 seconds of product research per candidate and answers the only question that matters at this stage: rising or dying. Set the window to 12 months, and check 5 years for anything that looks seasonal.
Amazon Best Sellers and Movers & Shakers are free, updated hourly, and organized by category. For product research, Movers & Shakers is the more useful of the two — it surfaces rank velocity rather than established position, which is closer to a trend signal.
eBay sold listings deserve special mention because they are the most underrated free product research source there is. Filter any search by “Sold Items” and you get 90 days of completed transactions with real prices. Not asking prices — transacted prices. Almost no product research guide leans on this, which is exactly why it stays useful.
Reddit and marketplace review sections give you the product research angle, not the product itself. Read complaints on a competitor’s listing and you will find the exact phrasing for your ad copy. Recurring questions — “will this fit a truck bed?”, “does it work with an iPhone?” — are audience segments nobody has targeted yet.
Keep this product research stage messy. A text file of product names is fine.
Step 2: Export the Numbers Instead of Copying Them
This is the step where free product research either becomes a real workflow or collapses back into three hours of scrolling. Product research without an export is just browsing with intent.
You have 200 candidates. For each one you need supplier cost, retail price, sold count, review count, and rating. Manually, that is five page visits and roughly two minutes of copy-pasting per product — around six to seven hours of pure data entry. Nobody sustains that weekly, which is why most people either quit product research or pay $39/month for a product research tool to skip it.
A scraper extension collapses product research data entry into a search-page export. You run the search you would have browsed anyway, click export, and get a CSV of every result on the page with prices, titles, ratings, and review counts as columns.
Practically, that means:
- Supplier cost — run your search on AliExpress and Temu, export both, and compare landed cost per unit across suppliers instead of opening tabs one at a time.
- Retail ceiling — export the same query from Amazon and Walmart to see what the market currently asks.
- Proven sales — export eBay sold listings for transacted prices and unit counts, the closest thing to free sales data that exists.
- Social commerce demand — export TikTok Shop listings to see units sold on products already going viral, and Shopee if you sell into Southeast Asia.
Same free product research sources every guide recommends. The only change is that your product research leaves you with columns instead of impressions.
Step 3: Triangulate Margin in One Product Research Sheet
Now merge your product research exports. One row per product, one column per source. This is where product research pays off, and it is impossible without Step 2.
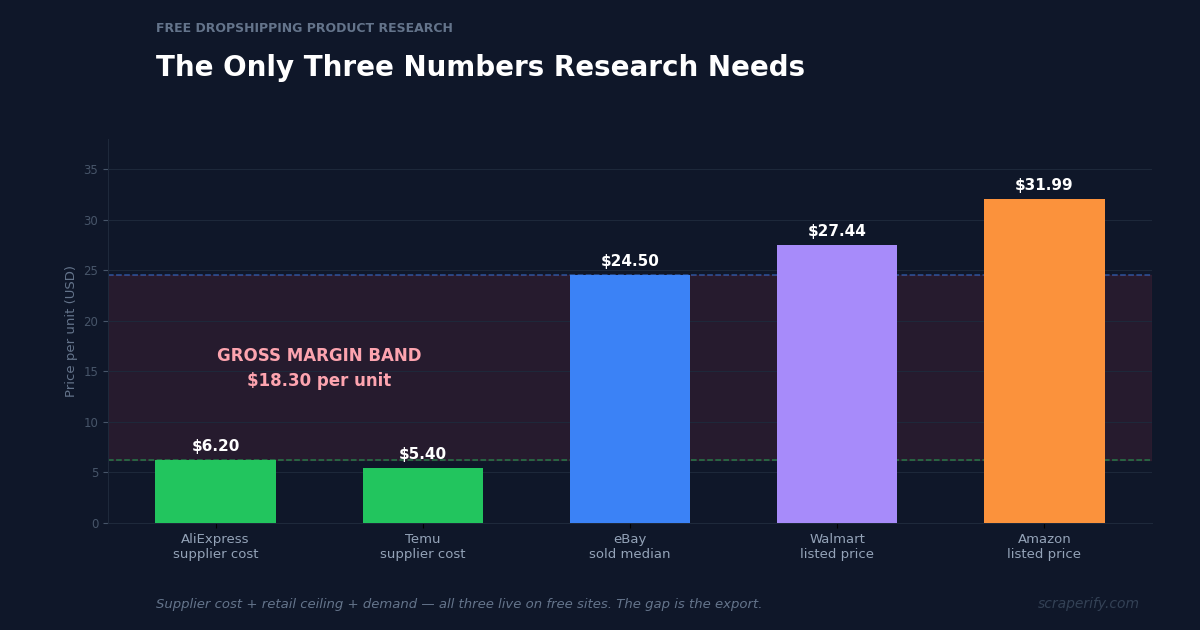
Say you exported a car headrest hook. AliExpress supplier cost lands at $6.20. Temu has a comparable unit at $5.40. eBay sold median over 90 days is $24.50 across 180 units. Walmart lists at $27.44. Amazon lists at $31.99.
Read that product research row across and the decision makes itself. Real buyers paid a median of $24.50 — that is not a hopeful asking price, it is 180 completed transactions. Your landed cost is $5.40 to $6.20. Gross margin is roughly $18.30 per unit, comfortably past the 3x rule. Amazon at $31.99 tells you the ceiling is higher than eBay’s median, so there is pricing headroom.
Now do that for 200 rows and sort by margin. That sorted column is the deliverable of good product research, and it is exactly the view a paid product research tool would have charged you for.
A few product research columns worth adding while you are there:
Price spread across platforms. A product selling for $24.50 on eBay and $31.99 on Amazon has a wide spread, which usually signals weak price discovery and room to position. A product priced within a dollar everywhere is a commodity — you will compete on ads alone.
Sold count ÷ active listings. High sales against few listings is the single best free proxy for an underserved niche. Both product research numbers are in your export already.
Review count as an age signal. A product with 40,000 reviews is mature and saturated. Under 500 reviews with rising trend is early.
Step 4: Validate Before Your Product Research Becomes Spending
You have a shortlist of 10. Before spending on ads or samples, product research needs one more pass — validation.
Check who else is selling it. Search the product on Amazon and Walmart. If Amazon itself is the seller, walk away — you cannot beat their pricing or shipping.
Estimate a competitor’s revenue. If a Shopify store is running ads for your product, a free traffic estimator like SimilarWeb gives monthly visits. Multiply by roughly 2.2% — the commonly cited average Shopify conversion rate — then by their selling price. Four thousand monthly visitors at $55.95 works out to about $4,900/month on that single product. That is a product research estimate, not gospel, but it separates “someone is making money here” from “someone is burning money here.”
Order a sample. Product research ends where physical inspection begins. Non-negotiable for anything you plan to scale, and the one product research step no data source replaces. Twenty-day shipping and a product that feels cheap in hand is a refund rate you will not survive.
Confirm the trend has not already peaked. Re-check Google Trends on the final shortlist. Product research goes stale — a candidate found six weeks ago may already be past its window.
Where Free Product Research Genuinely Falls Short
Being honest about the limits of free product research keeps this useful.
Free product research cannot give you competitor ad creatives with spend estimates and run duration. That is the one thing ad-spy tools like Minea and Pipiads genuinely own, because they maintain a historical ad archive that no public page exposes. TikTok Creative Center Top Ads is a partial free substitute, but it is not the same depth.
Free product research also will not hand you a curated “10 winning products this week” list. That curation has real value if your product research bottleneck is decision fatigue rather than budget.
And free product research cannot reconstruct historical price data. If you want to know what a product sold for six months ago, you needed to be collecting then. The practical fix is cheap: run your exports weekly and keep them. Six months of your own weekly CSVs is a product research dataset no tool sells you, and it is specific to your niche.
What free product research does cover — supplier cost, retail ceiling, proven sold volume, demand direction, review signals — is the part that actually determines whether a product makes money.
Run your first export in 5 minutes
Install the scraper for the marketplace you research most, run a search, click export. Free tier included — no card required.
Add Temu Scraper to Chrome — FreeFree tier · $19.99/month · $79 lifetime
A Repeatable Weekly Product Research Routine
Product research fails as a one-time project and works as a habit. Weekly product research beats one heroic session every time. Here is a schedule that fits in about 90 minutes a week.
Monday — product research collection (20 min). Scan TikTok Creative Center Top Ads for your category, plus Amazon Movers & Shakers. Add anything new to a running product research candidate list.
Tuesday — export (30 min). Run supplier searches on AliExpress and Temu, retail searches on Amazon and Walmart, and sold-listing searches on eBay. Export each to CSV. Date every filename so your product research stays comparable week to week.
Wednesday — merge and sort (20 min). Consolidate into your master product research sheet. Add the margin column. Sort descending. Look only at the top 10.
Thursday — validate (20 min). Check competition, estimate competitor revenue, confirm the trend. Order samples for anything that survives.
Friday — archive. Keep the week’s raw product research CSVs in a dated folder. This is the price-history asset that compounds.
Four weeks of this product research routine produces something no subscription gives you: your own longitudinal dataset for your own niche, showing which products held their price and which collapsed.
Common Mistakes That Waste Product Research Time
Product research that judges asking price instead of sold price. A listing at $49.99 with zero sales tells you nothing. eBay sold data is the correction, and it is free.
Ignoring landed cost. Unit price is not cost. Shipping, payment processing, and returns are real. A $6 unit with $7 shipping has different economics than the export column suggests.
Chasing what is already peaked. By the time a product is all over your feed, acquisition costs have caught up. The trend slope in your sheet is what protects you.
Product research without recording. The most common product research failure. Three hours of browsing that produces no file produces no compounding knowledge. Next month your product research starts from zero. An exported CSV is an asset; a browsing session is not.
Product research one item at a time. Single-product research has no baseline. A $14 margin means nothing until you see it ranked against 200 alternatives. Comparison requires a table, which requires an export.
Frequently Asked Questions
Can you really do dropshipping product research for free? Yes, for everything that determines profitability — supplier cost, retail ceiling, sold volume, and demand trend are all on public pages. The genuine gap is competitor ad history, which ad-spy tools own. Free product research covers the margin math completely.
What is the best free product research tool for dropshipping? There is no single product research tool that does it all. The best free product research stack is TikTok Creative Center for demand, Google Trends for timing, eBay sold listings for proven sales, AliExpress and Temu for cost, and Amazon and Walmart for the retail ceiling — plus an export step so the results land in one sheet.
How many products should I research before choosing one? Aim for 100–300 product research candidates narrowed to a shortlist of 10. The narrowing is only meaningful if the candidates sit in one sortable table.
Is eBay sold data really that useful for dropshipping? It is the most reliable free product research signal available. Sold listings show completed transactions with real prices over 90 days, which is closer to ground truth than any asking price or estimated-sales figure.
How long before I find a winning product? Treat product research as a weekly routine rather than a one-off search. Most sellers test several products before one works; the product research routine above makes each cycle cheap enough to repeat.
The Takeaway
The free product research sources are not the weak link. TikTok, Google Trends, AliExpress, Amazon, Walmart and eBay collectively expose every number a $39/month tool displays. The weak link is that browsing those sources produces impressions, and product research decisions require a table.
Add one export step to the product research workflow every guide already recommends and free product research stops being the budget option. You get the same sortable margin view, plus something the paid product research tools do not offer — a growing archive of your own weekly product research data for your own niche.
Start your product research with the marketplace you already browse most. Run one search, export it, and put the numbers in a sheet. That single habit is the whole difference between product research that compounds and product research that evaporates.
Build your product research spreadsheet
40+ Chrome extensions covering AliExpress, Temu, Amazon, Walmart, eBay, TikTok Shop and Shopee. Export search results to CSV in one click.
Browse all scrapersFree tier · $19.99/month · $79 lifetime
Related reading: Best Scraper Chrome Extensions · How to Track Walmart Prices · Resale Platform Price Comparison Report